Diagram#
- class discopy.monoidal.Diagram(inside, dom, cod, _scan=True)[source]#
Bases:
Arrow,WhiskerableA diagram is a tuple of composable layers
insidewith a pair of typesdomandcodas domain and codomain.- Parameters:
inside (tuple[Layer, ...]) – The layers of the diagram.
dom (T) – The domain of the diagram, i.e. its input.
cod (T) – The codomain of the diagram, i.e. its output.
Summary
tensor([other])Parallel composition, called using
@.The boxes in each layer of the diagram.
The offset of a box is the length of the type on its left.
draw(**params)Draws a diagram using networkx and matplotlib.
interchange(i, j[, left])Interchange a box from layer
ito layerj.normalize([left])Implements normalisation of boundary-connected diagrams, see Delpeuch and Vicary Delpeuch and Vicary [DV22].
normal_form(**params)Returns the normal form of a diagram.
- classmethod from_callable(dom, cod)[source]#
Define a diagram using the standard syntax for Python functions.
Note that we can specify the offset as argument.
Example
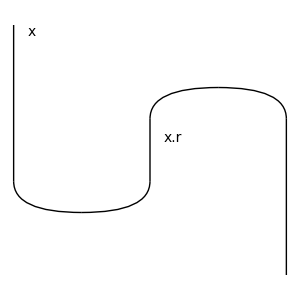
>>> x = Ty('x')
>>> cup, cap = Box('cup', x @ x, Ty()), Box('cap', Ty(), x @ x)
>>> @Diagram.from_callable(x, x)
... def snake(left):
...     middle, right = cap(offset=1)
...     cup(left, middle)
...     return right
>>> snake.draw(
...     figsize=(3, 3), path='docs/_static/drawing/diagramize.png')
- tensor(other=None, *others)[source]#
Parallel composition, called using
@.- Parameters:
- Return type:
Important
The definition of tensor is biased to the left, i.e.:
self @ other == self @ other.dom >> self.cod @ other
Example
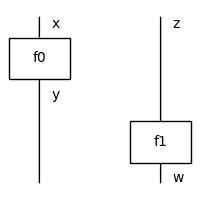
>>> x, y, z, w = Ty('x'), Ty('y'), Ty('z'), Ty('w')
>>> f0, f1 = Box('f0', x, y), Box('f1', z, w)
>>> assert f0 @ f1 == f0.tensor(f1) == f0 @ Id(z) >> Id(y) @ f1
>>> (f0 @ f1).draw(
...     figsize=(2, 2),
...     path='docs/_static/monoidal/tensor-example.png')
- property offsets: list[int]#
The offset of a box is the length of the type on its left.
- property width#
The width of a diagram, i.e. the maximum number of parallel wires.
Example
>>> x = Ty('x')
>>> f = Box('f', x, x ** 4)
>>> diagram = f @ x ** 2 >> x ** 2 @ f.dagger()
>>> assert diagram.width == 6
- encode()[source]#
Compact encoding of a diagram as a tuple of boxes and offsets.
Example
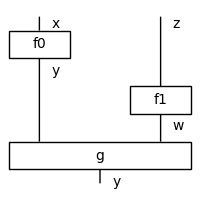
>>> x, y, z, w = Ty('x'), Ty('y'), Ty('z'), Ty('w')
>>> f0, f1, g = Box('f0', x, y), Box('f1', z, w), Box('g', y @ w, y)
>>> diagram = f0 @ f1 >> g
>>> dom, boxes_and_offsets = diagram.encode()
>>> assert dom == x @ z
>>> assert boxes_and_offsets == [(f0, 0), (f1, 1), (g, 0)]
>>> assert diagram == Diagram.decode(*diagram.encode())
>>> diagram.draw(figsize=(2, 2),
...        path='docs/_static/monoidal/arrow-example.png')
- classmethod decode(dom, boxes_and_offsets=None, boxes=None, offsets=None, cod=None)[source]#
Turn a tuple of boxes and offsets into a diagram.
- Parameters:
- Return type:
Example
>>> x, y, z, w = map(Ty, "xyzw")
>>> f, g = Box('f', x, y), Box('g', z, w)
>>> assert f @ z >> y @ g == Diagram.decode(
...     dom=x @ z, cod=y @ w, boxes=[f, g], offsets=[0, 1])
Note
If
boxes_and_offsets is Nonethen we set it tozip(boxes, offstes).
- to_drawing()[source]#
Called before
Diagram.draw().
- to_staircases()[source]#
Splits layers with more than one box into staircases.
Example
>>> x, y = Ty('x'), Ty('y')
>>> f0, f1 = Box('f0', x, y), Box('f1', y, x)
>>> diagram = y @ f0 >> f1 @ y
>>> print(diagram.foliation())
f1 @ f0
>>> print(diagram.foliation().to_staircases())
f1 @ x >> x @ f0
- foliation()[source]#
Merges layers together to reduce the length of a diagram.
Example
>>> from discopy.monoidal import *
>>> x, y = Ty('x'), Ty('y')
>>> f0, f1 = Box('f0', x, y), Box('f1', y, x)
>>> diagram = f0 @ Id(y) >> f0.dagger() @ f1
>>> print(diagram)
f0 @ y >> f0[::-1] @ y >> x @ f1
>>> print(diagram.foliation())
f0 @ y >> f0[::-1] @ f1
Note
If one defines a foliation as a sequence of unmergeable layers, there may exist many distinct foliations for the same diagram. This method scans top to bottom and merges layers eagerly.
- depth()[source]#
Computes (an upper bound to) the depth of a diagram by foliating it.
Example
>>> x, y = Ty('x'), Ty('y')
>>> f, g = Box('f', x, y), Box('g', y, x)
>>> assert Id(x @ y).depth() == 0
>>> assert f.depth() == 1
>>> assert (f @ g).depth() == 1
>>> assert (f >> g).depth() == 2
Note
The depth of a diagram is the minimum length over all its foliations, this method just returns the length of
Diagram.foliation().
- interchange(i, j, left=False)[source]#
Interchange a box from layer
ito layerj.- Parameters:
i (int) – Index of the box to interchange.
j (int) – Index of the new position for the box.
left – Whether to apply left interchangers.
- Return type:
Note
By default, we apply right interchangers:
top >> left @ box1.dom @ mid @ box0     @ right\
    >> left @ box1     @ mid @ box0.cod @ right >> bottom
gets rewritten to:
top >> left @ box1     @ mid @ box0.dom @ right\
    >> left @ box1.cod @ mid @ box0     @ right >> bottom
- normalize(left=False)[source]#
Implements normalisation of boundary-connected diagrams, see Delpeuch and Vicary Delpeuch and Vicary [DV22].
- Parameters:
left – Passed to
Diagram.interchange().- Return type:
Iterator[Diagram]
Example
>>> from discopy.monoidal import *
>>> s0, s1 = Box('s0', Ty(), Ty()), Box('s1', Ty(), Ty())
>>> gen = (s0 @ s1).normalize()
>>> for _ in range(3): print(next(gen))
s1 >> s0
s0 >> s1
s1 >> s0
- normal_form(**params)[source]#
Returns the normal form of a diagram.
params : Passed to
Diagram.normalize().- Raises:
NotImplementedError – Whenever
normalizeyields the same rewrite steps twice, e.g. the diagram is not boundary-connected.- Return type:
- draw(**params)#
Draws a diagram using networkx and matplotlib.
- Parameters:
draw_as_nodes (bool, optional) – Whether to draw boxes as nodes, default is
False.color (string, optional) – Color of the box or node, default is white (
'#ffffff') for boxes and red ('#ff0000') for nodes.textpad (pair of floats, optional) – Padding between text and wires, default is
(0.1, 0.1).draw_type_labels (bool, optional) – Whether to draw type labels, default is
False.draw_box_labels (bool, optional) – Whether to draw box labels, default is
True.aspect (string, optional) – Aspect ratio, one of
['auto', 'equal'].margins (tuple, optional) – Margins, default is
(0.05, 0.05).nodesize (float, optional) – Node size for spiders and controlled gates.
fontsize (int, optional) – Font size for the boxes, default is
12.fontsize_types (int, optional) – Font size for the types, default is
12.figsize (tuple, optional) – Figure size.
path (str, optional) – Where to save the image, if None we call
plt.show().to_tikz (bool, optional) – Whether to output tikz code instead of matplotlib.
asymmetry (float, optional) – Make a box and its dagger mirror images, default is
.25 * any(box.is_dagger for box in diagram.boxes).
- to_gif(*diagrams, **params)#
Builds a gif with the normalisation steps.
- Parameters:
diagrams (
Diagram, optional) – Sequence of diagrams to draw.path (str) – Where to save the image, if
Nonea gif gets created.timestep (int, optional) – Time step in milliseconds, default is
500.loop (bool, optional) – Whether to loop, default is
Falseparams (any, optional) – Passed to
Diagram.draw().
- to_grid()#
Layout a diagram on a grid.
The first row is a list of
Wirecells, then for each layer of the diagram there are two rows: the first for the boxes and the wires in between them, the second is a list ofWirefor the outputs.- Parameters:
diagram (monoidal.Diagram) – The diagram to layout on a grid.
- Return type:
>>> from discopy.monoidal import *
>>> x = Ty('x')
>>> f, s = Box('f', x, x @ x), Box('s', Ty(), Ty())
>>> diagram = (
...     f @ f[::-1] >> x @ s @ x @ x >> f @ f[::-1]).foliation()
>>> print(diagram.to_grid())
Grid([Wire(1, x), Wire(15, x), Wire(17, x)],
     [Cell(0, 12, f), Cell(14, 18, f[::-1])],
     [Wire(1, x), Wire(11, x), Wire(15, x)],
     [Cell(0, 4, f), Cell(6, 8, s), Cell(10, 16, f[::-1])],
     [Wire(1, x), Wire(3, x), Wire(11, x)])